
System information
An overview of the Aeneis installation is available in the Information section of the ServerAdministration:
-
All active sessions. You can also end the sessions via the X button
-
Server information
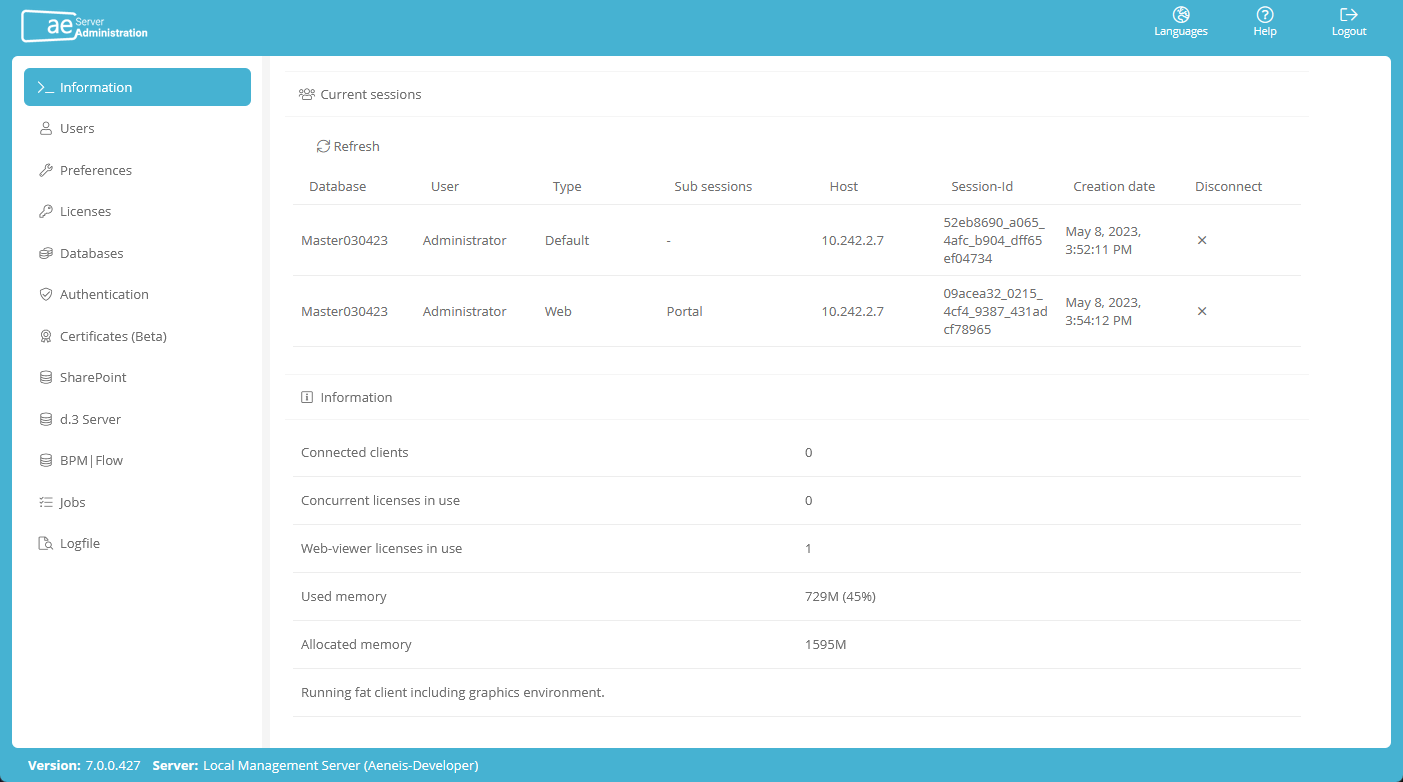
-
Graphical evaluations of server performance and memory:

In the upper pie chart, you can see the current memory usage. In the lower curve diagram you can see the utilization over the time period defined by the start time and end time in the upper left corner.
The following buttons are available in the Performance area:
-
Via Select you take a snapshot of the current working memory, which is displayed in the upper pie chart. At the same time, in the lower curve diagram, you update the time period defined by the start time and end time in the upper left corner.
-
Create Heap Dump allows you to perform a manual heap dump that informs about the system's memory allocations in a file. This file is saved in hprof format in the Aeneis application directory.
Requirements:
-
At least 30 GB of hard disk space is available.
Note: If the Enable system health monitoring setting is enabled in the server preferences, a heap dump is automatically performed.
-
-
Using the burger menus to the right of the diagrams, you can download the respective diagram in png, jpeg or svg format.
-